What Is Grid Trading
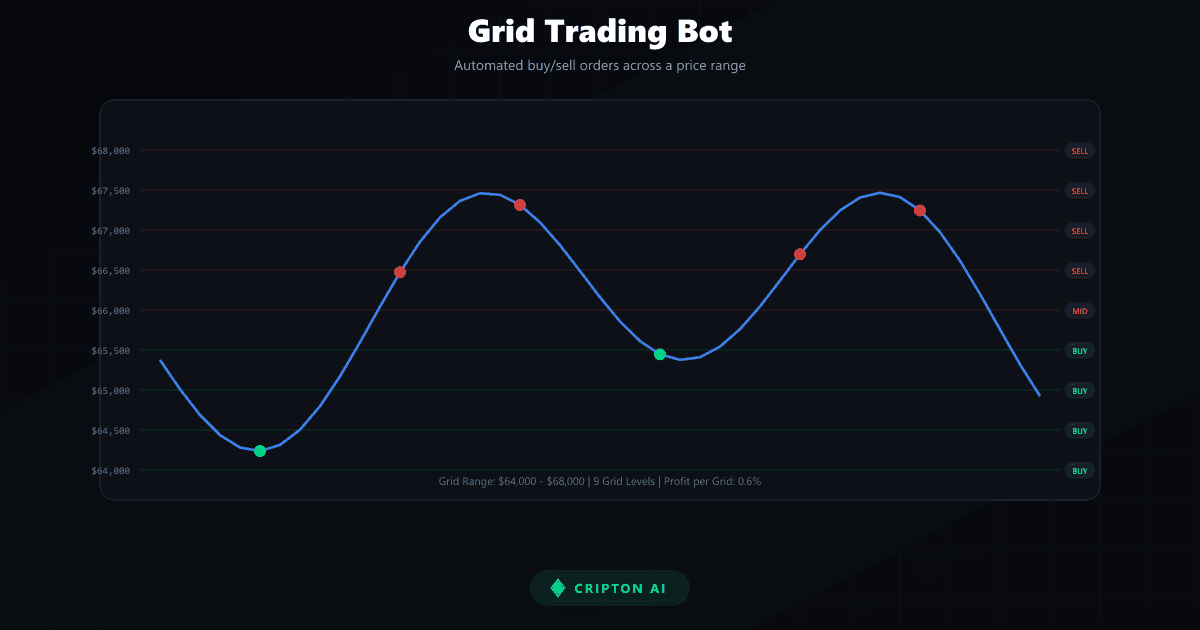
Grid trading is a market-neutral strategy that turns pure volatility into profit — with no opinion on whether price will rise or fall. The bot drops a lattice of buy and sell orders across a defined price range, and every time the market crosses a level, a trade executes.
Key Takeaways
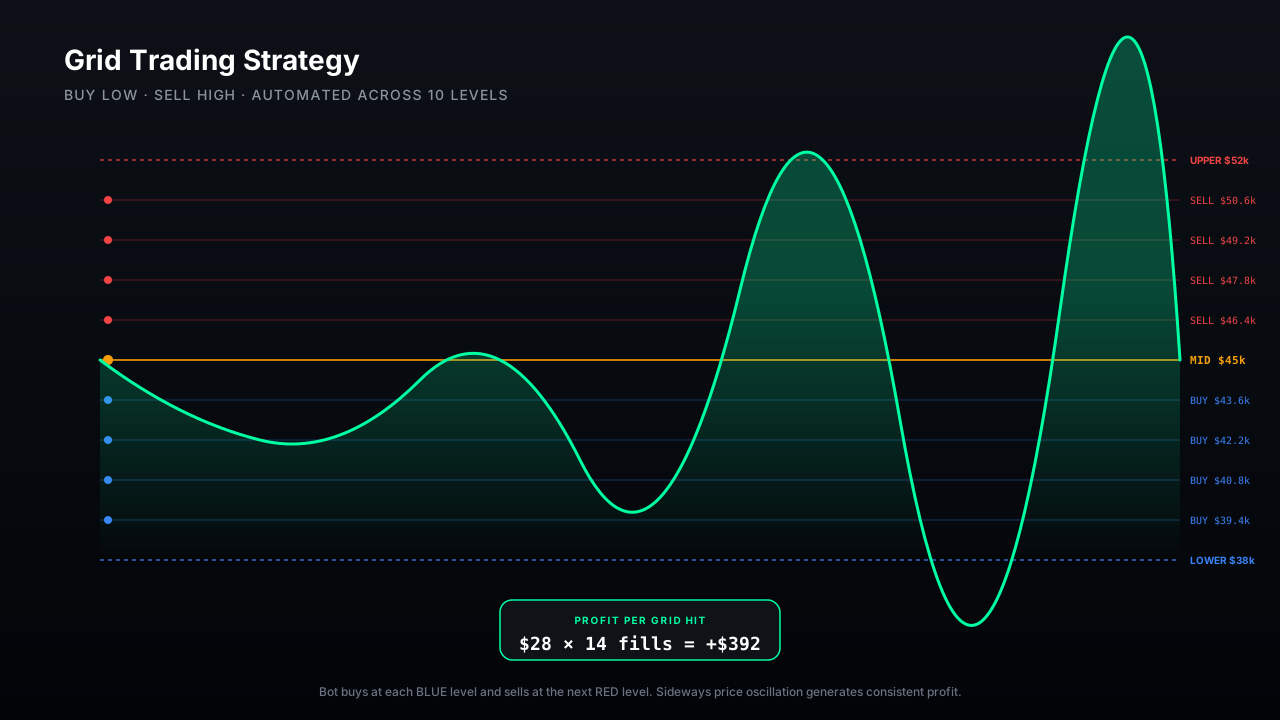
- 1Grid bots place buy orders below and sell orders above the current price.
- 2Each time price crosses a level, the bot locks in a small profit (grid spacing minus fees).
- 3Profit stacks up over time without needing any directional forecast.
- 4Works best in sideways markets — the more oscillation, the more profit.
How Grid Parameters Affect Performance
Five parameters define every grid bot. Misconfigure any one and the strategy becomes a slow capital drain — get them right and the bot compounds in sideways markets where directional traders are stuck waiting.
| Parameter | What it does | Conservative | Aggressive |
|---|---|---|---|
| Upper bound | Price ceiling — grid stops above this | Recent resistance | +25% above current |
| Lower bound | Price floor — grid stops below this | Recent support | -25% below current |
| Grid levels | How many buy/sell pairs inside range | 10–15 | 30–50 |
| Spacing mode | Arithmetic or geometric intervals | Geometric | Arithmetic |
| Allocation | Dollars deployed per level | $25–50 | $100+ |
Profit Mechanics: How Grid Trading Makes Money
Grid trading profits come from capturing the bid-ask spread at each grid level. Every time the price moves from one level to the next, the bot completes a round trip: buy at the lower level, sell at the higher level, and pocket the difference minus fees. The gross profit per grid trade is the grid spacing percentage.
If your grid spacing is 1%, each completed round trip earns approximately 1% minus trading fees. On an exchange with 0.1% maker/taker fees, your net profit per round trip is about 0.8%. If the price oscillates across your grid 50 times in a month, your return on invested capital is approximately 40%, which is excellent.
However, this assumes constant oscillation, which does not always happen. The actual annualized return depends on how volatile the market is within your range. During choppy, sideways markets, grid bots can generate 30% to 80% annualized returns. During strongly trending markets where the price moves out of range, returns drop significantly or become negative.
Grid profits compound naturally because profits from completed trades remain in the bot, increasing the capital available for future trades.
Grid Trading Risks and Limitations
Grid trading looks magical when the market is choppy, but it has brutal failure modes in trending markets. The profits are capped; the losses are not.
Grid Strengths
- • Market-neutral — profits in sideways chop
- • Fully automated — set once, monitor weekly
- • Compounds naturally via reinvestment
- • Emotionally easier than manual range trading
Grid Weaknesses
- • Fails badly in strong trends (breakout risk)
- • Fee drag can eat 30–50% of gross profit
- • Capital-hungry — idle orders tie up funds
- • Creates "inventory bag" on downside breakouts
- Breakout risk: price leaves your range → no more profit, only inventory.
- Fee drag: 0.1% fee on 0.5% spacing = 40% of gross profit gone.
- Opportunity cost: capital locked in unfilled orders earns nothing.
- Correlation risk: running 5 grids on correlated alts is not diversification.
Best Market Conditions for Grid Trading
Grid trading performs best during specific market conditions. Sideways or ranging markets are the ideal environment. Look for assets trading within a well-defined support and resistance range for weeks or months. The more the price oscillates within that range, the more profit the grid generates. High-volatility, low-trend environments are perfect.
You want the price moving a lot (hitting many grid levels) without moving decisively in one direction. Check the ADX (Average Directional Index) indicator: values below 25 suggest a ranging market suitable for grids. Stable, high-volume trading pairs like BTC/USDT and ETH/USDT provide the best grid trading conditions due to their reliable ranging behavior and tight spreads.
Avoid grid trading during strong trending markets (bull runs or bear crashes), low-volatility dead zones where the price barely moves, and thin-liquidity assets where your orders might not fill. Seasonality can also matter: many experienced grid traders note that crypto markets tend to range more during certain periods, particularly during post-halving accumulation phases and between major market catalysts.
Setting Up Your First Grid Bot
A 6-step checklist to ship your first grid bot safely. Do these in order — skipping any step is how beginners lose money in their first week.
Pick a high-liquidity major
BTC/USDT or ETH/USDT. Stay away from thin-liquidity alts on your first bot — wide spreads will destroy your grid math.
Identify the current range on the daily chart
Open TradingView, switch to daily candles, and mark the last 30–60 days of swing highs and lows. Your range should sit inside this zone.
Set upper/lower bounds 2–3% inside support/resistance
Give yourself a small buffer so minor wicks do not immediately break your range. If BTC support is $38k, set the lower bound at $39k.
Choose 15–20 grid levels with geometric spacing
This delivers ~0.8% spacing per level on a 15% range, which covers fees with room to spare.
Allocate no more than $500 for the first bot
Sizing small lets you learn the platform and spot misconfigurations without risking meaningful capital.
Enable trailing stop-loss at -10% from range midpoint
This is your safety net against a range breakdown. Without it, a strong downtrend traps all your capital as inventory.
Optimizing Grid Performance Over Time
Successful grid trading requires ongoing optimization. Monitor your bot performance weekly and adjust parameters as market conditions change. If the price consistently hits the upper bound, consider widening the range upward. If it gravitates toward the lower bound, you might need to lower the range or add a stop-loss.
Backtesting before going live is valuable. Many platforms offer backtest features that simulate grid performance using historical data. While past performance does not guarantee future results, backtesting helps you understand how different parameters would have performed and sets realistic expectations.
Multi-grid strategies involve running separate grid bots on different pairs or timeframes. This diversifies your grid income across multiple assets and reduces dependence on any single range holding. Some advanced traders combine grid bots with trend detection: running long grids during bullish phases and short grids during bearish phases, switching based on quantitative signals.
Cripton AI backtesting features allow you to simulate grid strategies across different assets and time periods, helping you identify optimal parameters before committing real capital.
Frequently asked questions
What Is Grid Trading?
Grid trading is an automated trading strategy that places a series of buy and sell orders at predefined price intervals above and below the current market price, creating a grid of orders. As the price fluctuates up and down within a range, the bot buys low at one level and sells high at the next, capturing small profits from each oscillation. Imagine Bitcoin trading between $65,000 and $75,000. A grid bot places buy orders at $65,000, $66,000, $67,000, and so on, with corresponding sell orders at each step above. When the price dips to $66,000, the bot buys. When it rises to $67,000, the bot sells that position for a $1,000 profit per coin. This process repeats continuously as the price bounces within the range. Grid trading is particularly effective in sideways or ranging markets where the price oscillates without a strong directional trend. Unlike trend-following strategies that need clear directional moves, grid bots thrive on the volatility that frustrates most manual traders. The strategy generates many small profits that compound over time.
How Grid Parameters Affect Performance?
Setting up a grid bot requires defining several key parameters that determine its performance. The upper and lower bounds define the price range where the bot operates. Set these based on support and resistance levels or historical price ranges. If the price breaks outside your range, the bot stops generating profits. Grid levels (or grid lines) determine how many buy/sell order pairs exist within your range. More levels mean more frequent trades with smaller profits each, while fewer levels mean less frequent trades with larger individual profits. A typical setup might use 10 to 30 grid levels. The grid spacing can be arithmetic (equal dollar intervals) or geometric (equal percentage intervals). Geometric spacing is preferred for crypto because it maintains consistent percentage profits at all price levels. Investment amount determines how much capital is allocated per grid level. The total required investment is approximately your per-level allocation multiplied by half the number of grid levels, since only buy-side levels need initial funding. Start with conservative parameters on a well-established asset like Bitcoin or Ethereum before experimenting with wider ranges or more exotic pairs.
Sources & references
Cripton AI is not affiliated with these platforms and does not endorse them. Verify each platform’s licensing in your country before using it.
Risk Disclaimer
This guide is for educational purposes only and does not constitute financial advice. Grid trading involves risks including capital loss during trending markets. Past performance and backtested results do not guarantee future returns. Only invest capital you can afford to lose.
Ready to start trading?
Create a free account and practice with paper trading — zero risk.
Start Free TrialKeep learning
Live crypto prices
View all prices ›