What Is Monte Carlo Simulation?
Monte Carlo simulation transforms trading from gut-feeling to probabilistic reasoning. Instead of a single backtest equity curve (which is just one of millions of possible outcomes), it shows you the entire distribution: best case, worst case, median, and every percentile in between.

Key Takeaways
- 1Monte Carlo generates thousands of possible equity paths from the same set of trade results.
- 2It reveals the RANGE of outcomes — not just the lucky sequence your backtest happened to show.
- 3The tail percentiles (5%, 1%) represent realistic worst-case scenarios your sizing must survive.
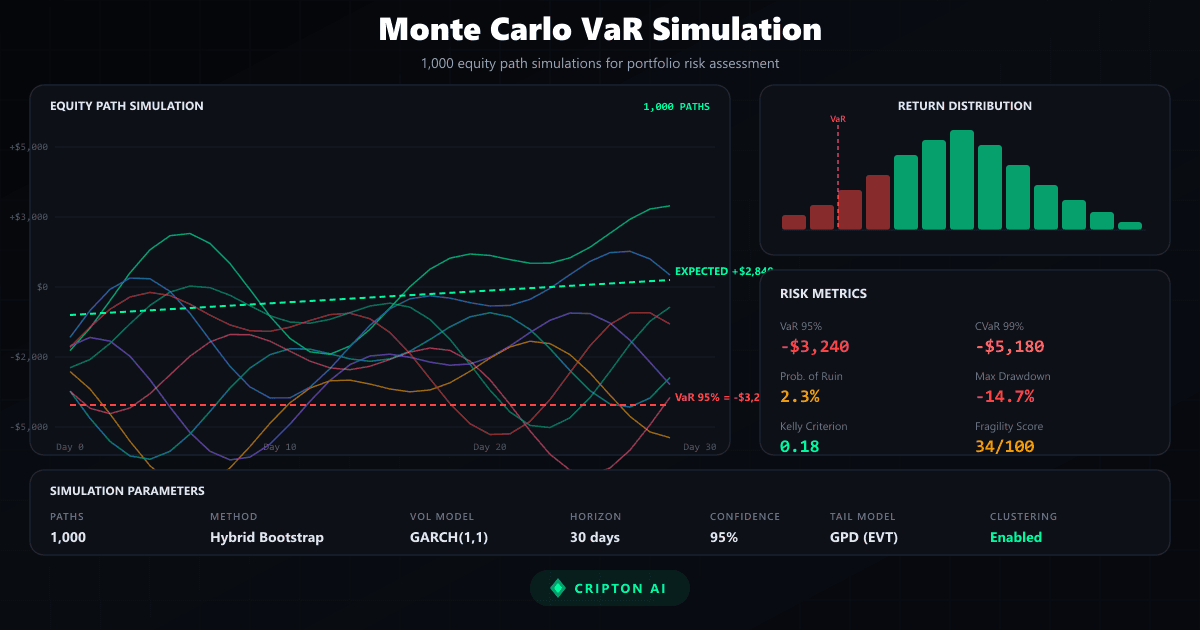
- 4Cripton AI runs 1,000+ paths with volatility clustering on EVERY signal before approval.
Why Order of Trades Matters
Consider a simple strategy with 60% win rate, average win of $200, and average loss of $150. Over 100 trades, this strategy makes $12,000 in wins and loses $6,000, netting $6,000 profit. Sounds great on paper. But what if 15 of those losses happened consecutively at the beginning? Starting with $10,000 and losing $2,250 before seeing a single win would drop your account to $7,750 — a 22.5% drawdown before the strategy "starts working." Most traders would quit or change their strategy before the wins arrived.
In another sequence, the losses might be evenly distributed among the wins, producing a smooth, gradually rising equity curve with a maximum drawdown of just 5%. Same trades, same net profit, radically different experiences. Monte Carlo simulation reveals this range. By running 10,000 permutations, you discover that the median maximum drawdown is 12%, the 95th percentile drawdown is 25%, and the worst case is 38%.
Now you can make an informed decision: am I comfortable with the possibility of a 25% drawdown? Should I reduce my position size so the 95th percentile drawdown drops to 15%? This probabilistic thinking is the foundation of professional risk management and is exactly what Cripton AI's Risk Authority uses to evaluate every signal.
Monte Carlo Methods in Crypto Risk Assessment
Cripton AI's Risk Authority runs a hybrid Monte Carlo on every signal BEFORE it enters the approval pipeline. Here is the exact flow from raw trade history to go/no-go decision:

| Metric | What it measures | Pass threshold |
|---|---|---|
| VaR 95% | Worst expected loss at 95% confidence | < 2% of equity |
| CVaR (ES) | Average loss in the worst 5% of all paths | < 3% of equity |
| Fragility Score | Sensitivity of results to market condition changes | < 60% |
| Probability of Ruin | Chance of catastrophic capital loss (>50%) | < 25% |
| Kelly Edge | Optimal position size for long-term capital growth | > -0.15 |
| Tail Risk Ratio | CVaR / VaR — how fat the loss tail is | < 3.0 |
Running Your Own Monte Carlo Analysis
You can perform a basic Monte Carlo simulation on any trading strategy with a spreadsheet and some basic programming, or use the built-in simulator on Cripton AI. The inputs you need are: a list of your historical trade results (profit or loss for each trade) and the number of simulations to run (1,000 is a good minimum, 10,000 is better).
The process: shuffle your trade results randomly, calculate the running equity balance for that sequence, record the maximum drawdown and final equity. Repeat 10,000 times. Plot the distribution of final equities and maximum drawdowns. For more realistic crypto simulations, add these enhancements: volatility clustering (after a large loss, the next few trades are more likely to also be volatile), position sizing adjustment (if your strategy sizes based on account balance, the equity at each step affects the next trade's size), and regime filtering (separate your trades by market regime and simulate regime transitions).
The Cripton AI Monte Carlo simulator on the dashboard lets you input custom parameters and visualize the equity path distribution, drawdown distribution, and statistical metrics without any programming. It uses the same engine that powers the Risk Authority's real-time signal evaluation.
Interpreting Monte Carlo Results
Reading Monte Carlo output is a skill. Here is how to turn the numbers into actionable trading decisions:
- Equity path fan chart — Look at the P5 (5th percentile) path. If it still ends above zero, the strategy survives even a statistically terrible sequence.
- Max drawdown distribution — If the median is 12% but the 95th percentile is 30%, you MUST be willing to stomach a 30% drawdown. Not theoretically — emotionally.
- Probability of ruin — The percentage of simulations where your account drops below 50%. Below 1% is excellent. Above 5% means the strategy is too risky at current sizing.
Robust Strategy
- • P5 equity path ends above breakeven
- • Max drawdown P95 < 20%
- • Prob of ruin < 1%
- • Sharpe range: 0.5 – 2.0 (tight)
- • Kelly edge > 0.10
Fragile Strategy
- • P5 equity path ends below -20%
- • Max drawdown P95 > 40%
- • Prob of ruin > 5%
- • Sharpe range: -1.0 – 3.0 (wild)
- • Kelly edge near zero or negative
Practical Applications for Crypto Traders
Use Monte Carlo simulation to validate any strategy before deploying real capital. After backtesting a DCA bot on the last 6 months and getting a 45% return with 15% max drawdown, run a Monte Carlo on those trade results. If the 95th percentile drawdown is 35%, you know the backtest was lucky and the actual risk is much higher.
Use it to determine position sizing. Run the simulation at your planned position size and check the 95th percentile drawdown. If it exceeds your comfort level, reduce size and re-run. Repeat until the worst-case scenario is survivable. Use it to compare strategies. Two strategies with the same average return but different Monte Carlo distributions have very different risk profiles.
The one with a tighter distribution (more consistent outcomes) is objectively better from a risk management perspective. Use it to set realistic expectations. A Monte Carlo simulation that shows a median annual return of 40% with a 5th percentile of -5% and 95th percentile of 120% tells you to expect somewhere in that range, with 40% being the most likely outcome.
This prevents the disappointment of expecting the best-case scenario or the panic of experiencing a below-median result.
Monte Carlo on Cripton AI
Cripton AI integrates Monte Carlo simulation at two levels. At the signal level, every trade signal passes through the Risk Authority's hybrid Monte Carlo engine before approval. The system evaluates VaR, fragility, Kelly edge, and probability of ruin using 1,000+ simulated equity paths based on historical outcomes scaled to current market conditions.
Signals that fail the risk thresholds are blocked automatically. At the user level, the Monte Carlo Simulator page on the dashboard allows you to run custom simulations with your own parameters — input your trade history or hypothetical win rate and average win/loss, and visualize the distribution of potential outcomes.
The interactive tool lets you adjust parameters in real time and see how changes in win rate, position size, or number of trades affect the probability distributions. The Oracle dashboard also displays Monte Carlo-derived metrics for each signal and asset: the VaR 95 tells you the expected worst-case loss, the fragility score indicates how sensitive the trade is to adverse conditions, and the Kelly edge suggests the optimal position size.
These metrics transform trading from guesswork into probabilistic decision-making. Understanding Monte Carlo simulation is arguably the single most valuable quantitative skill a crypto trader can develop.
Frequently asked questions
What Is Monte Carlo Simulation?
Monte Carlo simulation is a computational technique that uses random sampling to model the probability of different outcomes in a process that cannot be easily predicted due to random variables. In trading, it answers the question: "Given what I know about my strategy's historical performance, what range of outcomes should I realistically expect going forward?" Rather than looking at a single backtest result and assuming that is what will happen, Monte Carlo simulation generates thousands of possible equity paths by randomly reshuffling your historical trade results. If your strategy had 100 historical trades, a Monte Carlo simulation might run 10,000 permutations, each time randomly reordering those 100 trades to create a different sequence of wins and losses. The result is not a single equity curve but a probability distribution of outcomes — you can see the best-case scenario, worst-case scenario, and everything in between. This is enormously more valuable than a single backtest because it reveals how sensitive your results are to the order of trades. A strategy might show a smooth equity curve in one sequence but have a devastating 40% drawdown in another, using the exact same trades in a different order.
Why Order of Trades Matters?
Consider a simple strategy with 60% win rate, average win of $200, and average loss of $150. Over 100 trades, this strategy makes $12,000 in wins and loses $6,000, netting $6,000 profit. Sounds great on paper. But what if 15 of those losses happened consecutively at the beginning? Starting with $10,000 and losing $2,250 before seeing a single win would drop your account to $7,750 — a 22.5% drawdown before the strategy "starts working." Most traders would quit or change their strategy before the wins arrived. In another sequence, the losses might be evenly distributed among the wins, producing a smooth, gradually rising equity curve with a maximum drawdown of just 5%. Same trades, same net profit, radically different experiences. Monte Carlo simulation reveals this range. By running 10,000 permutations, you discover that the median maximum drawdown is 12%, the 95th percentile drawdown is 25%, and the worst case is 38%. Now you can make an informed decision: am I comfortable with the possibility of a 25% drawdown? Should I reduce my position size so the 95th percentile drawdown drops to 15%? This probabilistic thinking is the foundation of professional risk management and is exactly what Cripton AI's Risk Authority uses to evaluate every signal.
Sources & references
Cripton AI is not affiliated with these platforms and does not endorse them. Verify each platform’s licensing in your country before using it.
Risk Disclaimer
This guide is for educational purposes only. Monte Carlo simulations are based on historical data and assumptions that may not hold in future market conditions. Cryptocurrency trading involves substantial risk. Simulation results are probabilistic, not guaranteed.
Ready to start trading?
Create a free account and practice with paper trading — zero risk.
Start Free TrialPrevious Guide
Risk Management for Crypto Trading Bots: Essential Guide
Next Guide
Futures Liquidation Explained: How to Avoid Getting Liquidated
Keep learning
Live crypto prices
View all prices ›