What Is Monte Carlo VaR?
Value at Risk (VaR) is a statistical measure that quantifies the maximum expected loss of a portfolio over a specific time period at a given confidence level. For example, a 95% daily VaR of $500 means there is only a 5% chance that the portfolio will lose more than $500 in a single day. Monte Carlo VaR achieves this estimate by simulating thousands of possible future price paths using random sampling, rather than relying on simplified mathematical formulas.
This approach captures complex market dynamics like fat tails, volatility clustering, and non-linear correlations that simpler methods miss. For crypto portfolios, where extreme moves are common, Monte Carlo VaR provides a far more realistic risk assessment than traditional parametric methods.
How Monte Carlo Simulation Works
A Monte Carlo simulation generates thousands of hypothetical price trajectories by randomly sampling from historical return distributions. The most common model is Geometric Brownian Motion (GBM), which assumes returns follow a log-normal distribution with drift and volatility parameters estimated from historical data.
However, crypto markets exhibit heavy tails and volatility clustering that GBM does not capture well. More advanced approaches use bootstrap methods that resample actual historical returns (preserving their fat-tailed distribution) and apply volatility clustering models like GARCH to simulate realistic periods of calm followed by sudden spikes in volatility.
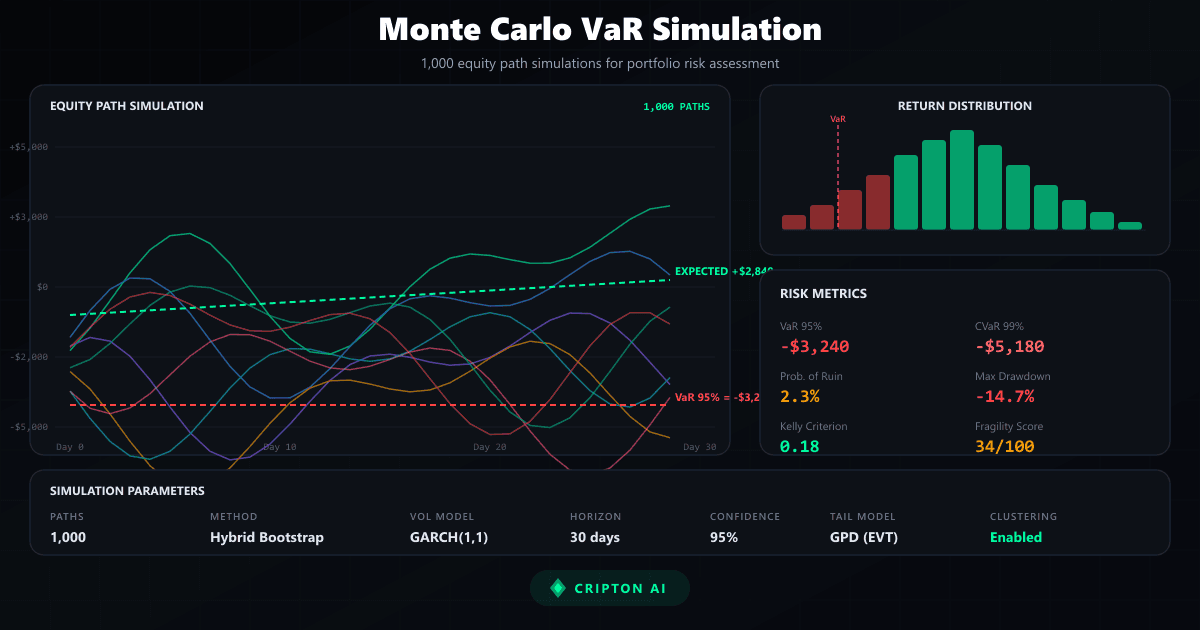
By running 1,000 or more simulated paths, the method builds a probability distribution of potential outcomes from which VaR and other risk metrics can be extracted.
VaR in the Crypto Context
Cryptocurrency markets present unique challenges for risk measurement. Volatility in crypto is typically 3-5 times higher than in traditional equity markets, and price distributions exhibit significant fat tails, meaning extreme events occur far more frequently than a normal distribution would predict.
Market regimes can shift abruptly, transitioning from calm accumulation to violent sell-offs within hours. These characteristics make parametric VaR, which assumes normally distributed returns, dangerously unreliable for crypto. A parametric model might estimate a 95% VaR of 5% when the actual risk of a daily move exceeding 10% is quite real.
Monte Carlo methods, especially when combined with regime-aware volatility models, provide a much more honest picture of the true risk landscape in crypto markets.
How Cripton AI Uses Monte Carlo
Cripton AI runs a 1,000-path hybrid Monte Carlo simulation for every signal evaluated by the platform. The simulation combines bootstrap resampling of historical outcomes with volatility clustering to generate realistic equity curves. From these simulated paths, the system extracts multiple risk metrics: VaR at the 95th percentile, Conditional VaR (CVaR) for tail risk, fragility scoring that measures how sensitive the strategy is to adverse conditions, Kelly edge for optimal position sizing, and probability of ruin to assess catastrophic loss scenarios.
These metrics directly influence position sizing: higher VaR reduces allowed position size, while a favorable Kelly edge may permit slightly larger allocations. The fragility score acts as a circuit breaker, blocking trades when simulated outcomes show excessive sensitivity to market stress.
Limitations and Risk Disclosure
While Monte Carlo VaR is a powerful risk management tool, it has important limitations that every trader should understand. All simulations are based on historical data, and past market behavior does not guarantee future outcomes. Black swan events, which by definition are unprecedented, cannot be fully captured by any historical model.
VaR is not a worst-case measure; it tells you the loss that will not be exceeded 95% of the time, but the remaining 5% of scenarios can produce losses far larger than the VaR figure. Additionally, model assumptions like return distributions and correlation structures may break down during extreme market stress.
For these reasons, VaR should always be used alongside other risk management tools such as stop-loss orders, position size limits, and portfolio diversification. Never risk more than you can afford to lose.
Frequently asked questions
What Is Monte Carlo VaR?
Value at Risk (VaR) is a statistical measure that quantifies the maximum expected loss of a portfolio over a specific time period at a given confidence level. For example, a 95% daily VaR of $500 means there is only a 5% chance that the portfolio will lose more than $500 in a single day. Monte Carlo VaR achieves this estimate by simulating thousands of possible future price paths using random sampling, rather than relying on simplified mathematical formulas. This approach captures complex market dynamics like fat tails, volatility clustering, and non-linear correlations that simpler methods miss. For crypto portfolios, where extreme moves are common, Monte Carlo VaR provides a far more realistic risk assessment than traditional parametric methods.
How Monte Carlo Simulation Works?
A Monte Carlo simulation generates thousands of hypothetical price trajectories by randomly sampling from historical return distributions. The most common model is Geometric Brownian Motion (GBM), which assumes returns follow a log-normal distribution with drift and volatility parameters estimated from historical data. However, crypto markets exhibit heavy tails and volatility clustering that GBM does not capture well. More advanced approaches use bootstrap methods that resample actual historical returns (preserving their fat-tailed distribution) and apply volatility clustering models like GARCH to simulate realistic periods of calm followed by sudden spikes in volatility. By running 1,000 or more simulated paths, the method builds a probability distribution of potential outcomes from which VaR and other risk metrics can be extracted.
How Cripton AI Uses Monte Carlo?
Cripton AI runs a 1,000-path hybrid Monte Carlo simulation for every signal evaluated by the platform. The simulation combines bootstrap resampling of historical outcomes with volatility clustering to generate realistic equity curves. From these simulated paths, the system extracts multiple risk metrics: VaR at the 95th percentile, Conditional VaR (CVaR) for tail risk, fragility scoring that measures how sensitive the strategy is to adverse conditions, Kelly edge for optimal position sizing, and probability of ruin to assess catastrophic loss scenarios. These metrics directly influence position sizing: higher VaR reduces allowed position size, while a favorable Kelly edge may permit slightly larger allocations. The fragility score acts as a circuit breaker, blocking trades when simulated outcomes show excessive sensitivity to market stress.
Sources & references
Cripton AI is not affiliated with these platforms and does not endorse them. Verify each platform’s licensing in your country before using it.
Risk Disclaimer
Simulations are based on historical data and do not guarantee future performance.
Ready to start trading?
Create a free account and practice with paper trading — zero risk.
Start Free TrialPrevious Guide
Grid Bot Trading Strategy: Complete Guide for Crypto
Next Guide
VPIN & Order Book Imbalance: Algorithmic Crypto Trading
Keep learning
Live crypto prices
View all prices ›